Bitcoin Supply Shock: The Exchange Float
OCTOBER 7, 2026, 5:10 PM · updated October 7, 2026, 6:00 PM
On October 7th, Bitcoin Magazine posted a chart with a headline in capital letters: the supply of Bitcoin available on exchanges "has declined to its lowest level in 7 months," followed by "BTC is becoming more scarce, plan accordingly!" The post gave no figure, named no data provider, and was liked about seven hundred times, which is roughly how supply shocks get priced on the internet.
I'm going to treat that as the opening entry of a standing page rather than a one-day take. The exchange float is the number most people mean when they say "supply shock," it moves slowly, and it is very easy to say something confident about it and very hard to say something true. So this page does three things: it records each reading with a date and a named source, it says what the reading does and doesn't prove, and it gets updated in place when the number moves.
What the Float Is, and Why Anyone Watches It
Coins sitting in exchange wallets are the coins that can be sold within minutes. Coins sitting anywhere else need a step first: an unlock, a transfer, a decision. When the amount on exchanges falls, the simple story is that holders are pulling coins off the shelf, and a market with less on the shelf reacts harder to the same amount of buying. That story is the whole "supply shock" thesis, and it is not crazy. It is also a story about behavior told with a balance, which is where it starts to wobble.
The Latest Reading
Bitcoin Magazine's post names no provider, so I went looking for numbers that do. The cleanest series is Santiment's, which counts exchange balances as a share of all Bitcoin. On October 6th, KuCoin's news flash relayed Santiment's reading: exchanges held 6.5% of the supply. On July 9th, CoinDesk, citing Santiment, had it at 6.6%, the lowest since 2017. Three months, a tenth of a point: that is a line sitting on a multi-year floor, not one that just broke to a new seven-month low.
What Santiment did flag on October 6th was a flow: 24,073 BTC left exchanges on net the day before, the largest single-day outflow in seven months. My guess, and it is only a guess, is that "seven months" in the tweet belongs to that outflow and got restated as a level. I can't confirm it, because the post doesn't say which data it used.
Published Readings So Far
| Date | Provider | Reading | Where I read it |
|---|---|---|---|
| Oct 6, 2026 | Santiment | 6.5% of supply; 24,073 BTC net outflow in a day | KuCoin |
| Jul 9, 2026 | Santiment | 6.6% of supply, lowest since 2017 | CoinDesk |
| Mar 6, 2026 | CryptoQuant | under 2,708,000 BTC, called the lowest since Nov 2018 | U.Today |
| Oct 2025 | Glassnode | about 2.83 million BTC | Cryptonews |
| Dec 2024 | CryptoQuant | about 2.46 million BTC, a multi-year low | The Block |
Read it by provider, never across rows. Even one provider's own history doesn't line up: CryptoQuant's December 2024 figure (2.46 million) is lower than its March 2026 figure (2.71 million), and the 2026 number was still described as the lowest since 2018. That doesn't make either article wrong. It means a provider's list of exchange wallets gets revised, and old headlines keep the old definition.
Two Providers, Two Answers
The reason this page insists on naming a provider: the providers do not agree. When exchange balances fell to what was then a six-year low in October 2025, Cryptonews reported Glassnode's figure at about 2.83 million BTC and CryptoQuant's at about 2.45 million, the same market on the same day, roughly fifteen percent apart. Each firm decides for itself which wallets count as "an exchange," and neither list is public. So a reading is only comparable to a reading from the same provider, and a "seven-month low" from an unnamed chart is a direction, not a measurement.
Evidence, Not Proof: Where the Coins Went
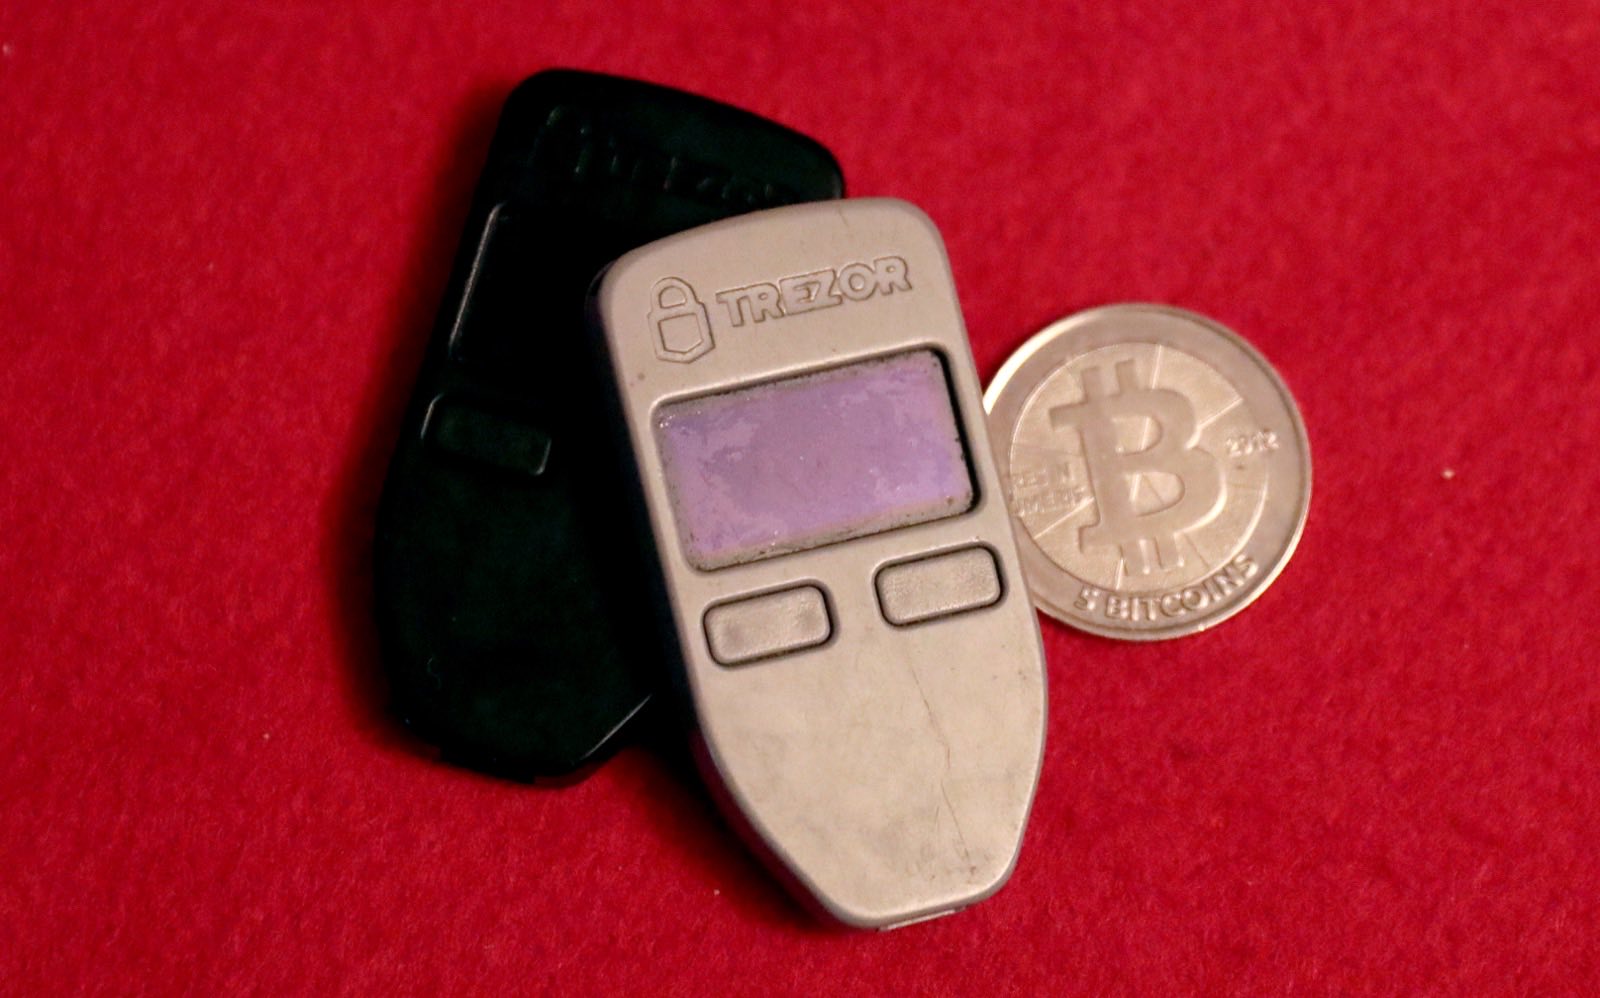
A coin that leaves an exchange has to land somewhere, and the somewhere changes what it means. Self-custody is the version the slogan imagines: a person, a hardware wallet, a long time horizon. But the same drop in the exchange number is produced just as well by coins moving into a spot ETF's custodian, into a bank's custody product, or onto the balance sheet of a public company, all of which are large, all of which count as "off the exchange," and none of which is a promise never to sell. CoinDesk's July piece puts numbers on it: U.S. spot Bitcoin ETFs hold more than 641,400 BTC, and it argues that part of what leaves exchanges goes to DeFi uses that keep the coins liquid, which is why it says the metric "doesn't pack the same bullish punch anymore." In 2022, it notes, exchange supply stayed low while prices fell. The treasury-company version of the story is one I can look at directly: the Bitcoin Treasuries board ranks who holds the coins, and the Bitcoin Board carries the network's own supply numbers. If the float is falling while those holdings are rising, the coins moved sideways, from one building to another. If it falls while neither moves, that is a stronger hint that real holders are sitting tight. I don't have that comparison built yet; it is the obvious next entry.
What I'm Going to Do With This Page
- Log each reading by hand, dated, with the provider named, and never mix providers in one series.
- Pair every reading with the other side: ETF and treasury holdings over the same window, so "left exchanges" can be split into "went to a vault" and "went to a bank."
- Update in place with dated sections below, the way the other standing pages here work, rather than writing a fresh post each time the line wiggles.
Where I Could Be Wrong
Three ways, in rising order of embarrassment. First, the "seven-month low" is one chart in one post, and I haven't seen the underlying data or the provider's wallet list, so the claim could be real and still mean less than it sounds. Second, falling exchange balances have preceded rallies and have also sat there while prices went nowhere; a balance is not a forecast, and "plan accordingly" is the investment-advice equivalent of "weather: yes." Third, I may be over-weighting the leak into ETFs and treasuries because it is the explanation I can check. If the next readings come in with a named provider and the holdings data doesn't explain them, I'll say so here, above the fold, in plain words. None of this is advice to buy or sell anything.